In October 2015, I was diagnosed with hypertriglyceridemia… basically, I wasn’t eating healthy and I wasn’t doing enough (ehem… any) exercise.
I started a serious diet (one provided by a doctor) and a serious training plan… I started doing spinning but then I tried running… in 3 months all my blood tests were great and I was on a healthy weight… but the best part of this experience is… I discovered a new passion… RUNNING!
Since then, I joined a running team, I’m beating my records and I’m enjoying it a lot. My coach is great and the training plan I’m following is pretty standard. As the good nerd I am, I bought a running watch (because… what good is running if I don’t have METRICS???). I started with the Fitbit Surge but I soon found its limitations unbearable… that’s why I bought a Garmin Forerunner 630, and I’m super happy with it.
One of the coolest features it has is giving you the chance to do interval training, and setting up a plan on the computer that you can send to the watch so that when you’re running it vibrates and tells you to run, rest, or whatever you planned to do. BUT… and there’s always a but… all the resting activities are stored as “splits” then lowering your numbers.
Here’s an example… I had to run 12 1km intervals (0.62 miles) resting 1:30
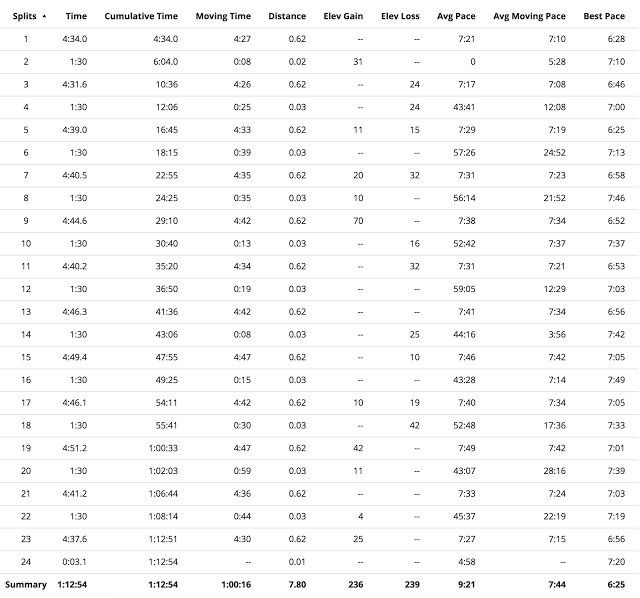
You can see that all the even numbers last 1:30, have a crappy Avg Pace (because I was resting) and basically screw my activity numbers… because it says that my Average Page was 9:21 minutes/mile… I was super frustrated by this… so instead of just doing the numbers in excel… I developed an extension that hides those splits and updates the numbers for me :) you can view its source code here (I took it down from the store after… not really using it). Basically, you define the criteria of which laps you want to hide and it converts that table to this (now satisfying) one:
Yayyy!!! 7:33 minutes/mile!!! now we’re talking :)
I was able to build this in 3 days, basically extensions are just HTML/JS pages so you can leverage a lot of that knowledge. I also found the documentation super straightforward… so let’s start digging into the meaty parts of this:
- I wanted to make it configurable per activity (I don’t want it to hide ALL the splits that are below a given threshold, sometimes it’s part of the training to run slow)
- I wanted to pick up from the garmin website if the user uses miles or kms (I use kms, but I really think this extension could be useful for people all over the world)
- I wanted all the numbers in the activity page to be updated (not just the splits and their averages)
- I wanted to make it easy to set up
You can see the activity I used for this screenshot here. Basically, if you check the source code and the DOM, you’ll see it’s using backbone.js. Honestly, I didn’t feel particularly inclined to learn that… I was hoping there would be some kind of global object where I would be able to see all the data and basically just tweak it… but… nope… all what backbone exposes are functions that the Garmin people is calling with well defined parameters (sometimes, even deleting the global variables once they’ve been used to initialize their objects).
So… not really understanding how their webapp works (and not feeling particularly curious about it) I started checking out other options… I checked the XHR requests and I noticed they were querying https://connect.garmin.com/modern/proxy/activity-service/activity/1278494312/splits?_=1470259487305 which includes the laps info… eureka! that’s it… all I needed then was to have a way for my extension to tweak this XHR response so that Garmin’s webapp would show my injected version instead of their own.
Thanks to a Stack Overflow answer I lost, I found out this a blog post (now deleted) at https://izaakschroeder.wordpress.com that explains clearly how to achieve that (so all props to that guy… minus the points he looses for posting how to exploit a vulnerability before letting the company know about it). So with that, I was able to easily modify any request and tweak it… and the webapp would consider my data the truth… yay!!
Well, then an interesting thing happened… the webapp does a request to an activity url (https://connect.garmin.com/modern/proxy/activity-service/activity/1278494312?_=1470259487283) that contains the summary BEFORE requesting the splits data… so what I ended up doing was intercepting that request as well, fetching the splits, filtering them and updating the summary (you can see that here).
Once I had that ready, I wanted to pick up the units the user was using… I found out that the HTML of the page declares a global variable VIEWER_USERPREFERENCES with that info… but in the common.js file, I saw that they’re deleting it after using it… so I ended up doing something waaay uglier (but that gets the job done). On the background script, I just give it 5 seconds (so that the DOM elements get initialized) and then just get an element that contains the distance :)
The hardest part of this project was letting go my initial idea… I really wanted to see the backbone data somewhere. Once I broke free from that and found an easy way to modify the XHR responses, it all flowed naturally… so if you’re on the fence about writing a chrome extension, by all means give it a try!